Debugging Tools
You can stop the execution of the application with the breakpoints. Use debugging tooltips to see variable values on the fly when the breakpoint is reached. While your code is broken in the debugger, you can see the contents of local and global variables using Locals or Watch windows. You can also change the values of the variables.
You can see the function calls that are currently on the stack: the Call stack window shows the order in which methods and functions are getting called.
Tools used during debugging:
Handling the debugging process
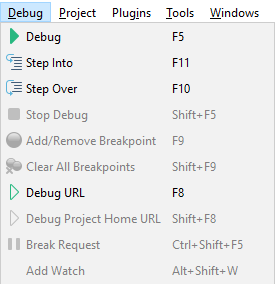
You can handle the debugging process using Debug toolbar: 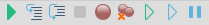 or from the main menu . Also, you can
use the hotkeys in the
debugger.
or from the main menu . Also, you can
use the hotkeys in the
debugger.
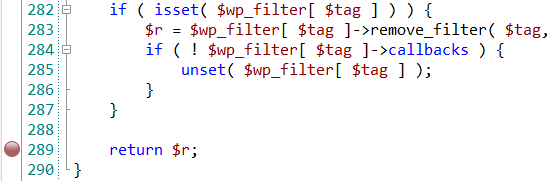
Breakpoints
A breakpoint is a marker that stops the execution of the application at the line in which it is placed. Line breakpoints can be set on executable lines of code. Thread execution is suspended before the line with such breakpoint, and CodeLobster IDE displays the stack frames on that thread's stack. When the debugger stopped at the breakpoint, you can edit the values of most variables in the Locals window.
To set a line breakpoint:
-
Place the caret at an executable line of code where you want to set a breakpoint.
-
Click the left gutter next to that line; a red bubble-shaped marker will appear on the left of the line.
or
Select main menu item or press F9 hotkey.
![[Tip]](images/admon/tip.png)
Tip Similar steps are applied for removing breakpoints.
To remove a line breakpoint
-
Click the left gutter next to that line or press F9 hotkey.
-
Select main menu item.
To remove all breakpoints
-
Select or press Shift + F9.
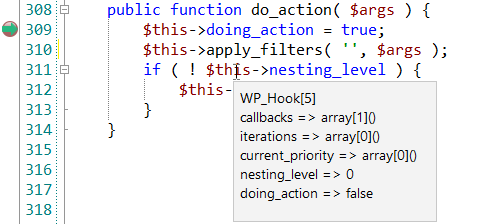
Tooltips
While debugging, you can hover a data item to view its value in a debug tooltip. This feature is used for reviewing variable values on the fly when the breakpoint is reached. Hover over an element, and its value will be highlighted in a tooltip box.
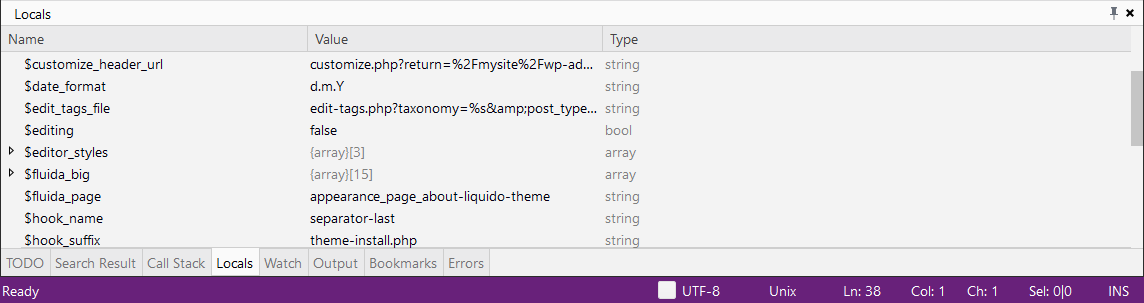
Locals window
The Locals window shows variables of the current scope, while you are debugging. Locals window displays both Global and Local variables, their values, and type. Arrays and objects show in the Locals window as tree controls. They also allow expanding objects and array to see their members by clicking the ▷ expansion indicator.
You can edit the values when the debugger stopped at the breakpoint. To edit the values of most variables in the Locals window, double-click the value and enter the new value.
| Tip |
|---|---|
|
Also you can copy Name or Value using right-click menu |
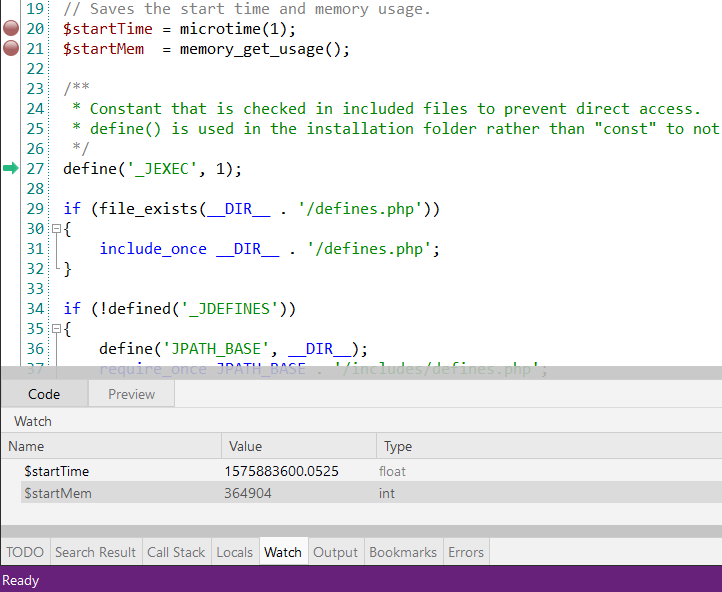
Watch window
The Watch window accepts variables, objects, and expressions you want to monitor while debugging. Watch windows can display several variables at a time. While debugging, you can examine and evaluate variables and expressions using the Watch windows.
There are various ways for adding watches: place the pointer on necessary element and
-
select main menu item or press Alt + Shift + W hotkeys
or
-
use Add watch from the right-click menu
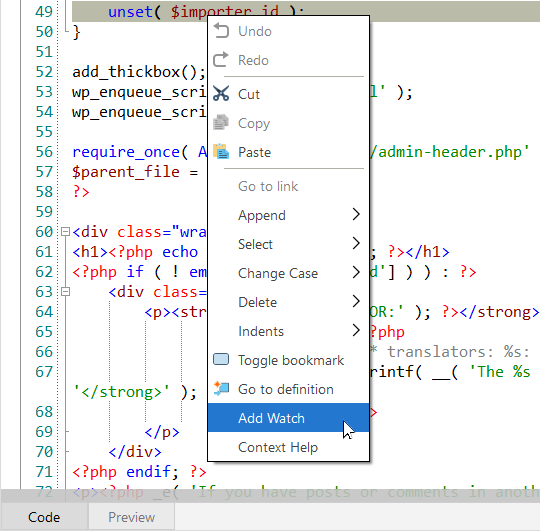
Another way to add watch: copy-Paste element name into the Watch window (right-click on item).
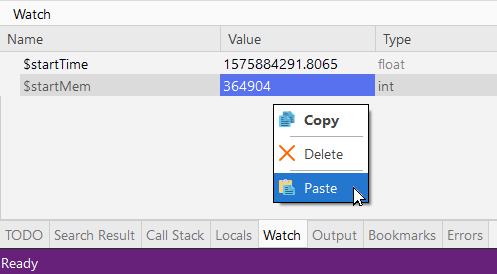
To delete the element from the Watch window, select the one and use Delete item from the mouse right-click menu.
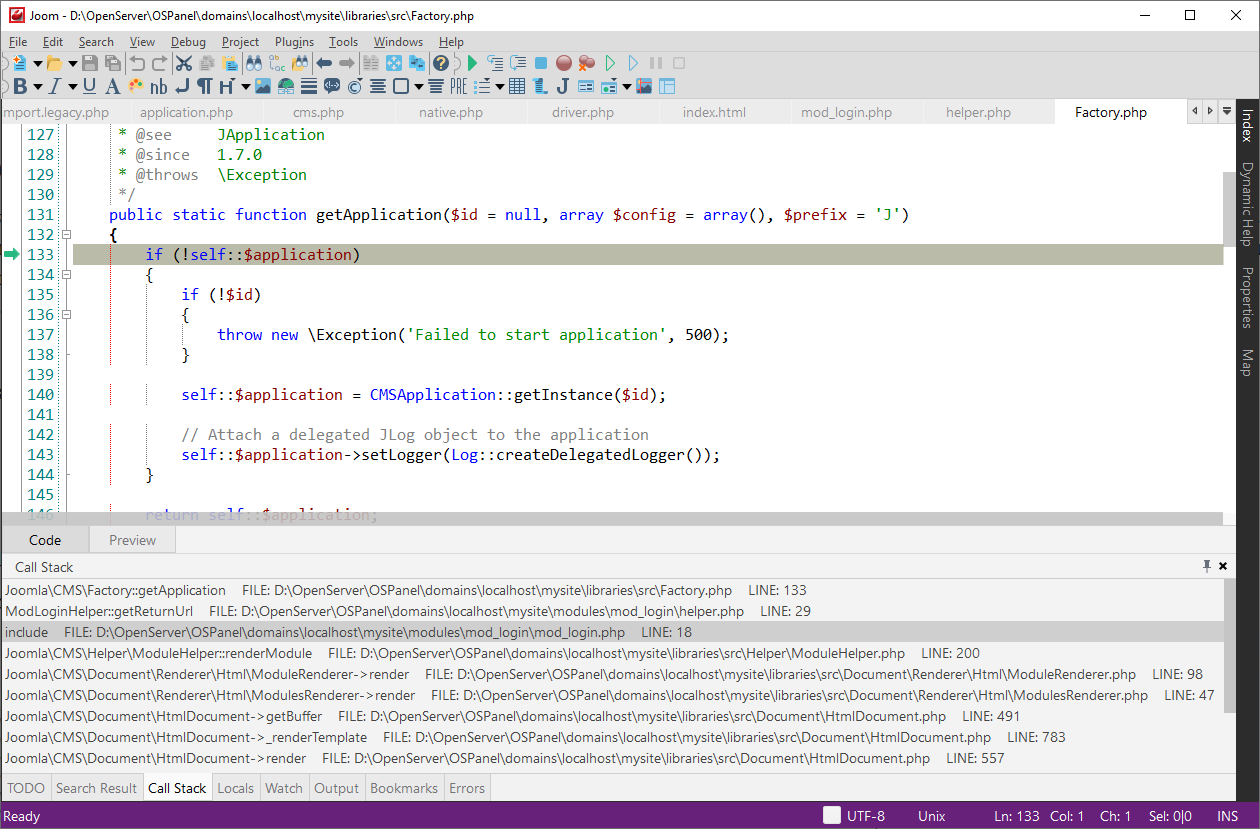
Call stack window
The Call Stack window contains all functions called during debugging. You can see the function calls that are currently on the stack: the window shows the order in which methods and functions are getting called. It's a good way to examine and understand the execution flow of an app. The Call Stack window displays the name of each function, file name, and line number. A green arrow identifies the stack frame where the execution pointer is currently located. By default, this is the frame whose information appears in the source, Locals and Watch windows.
| Tip |
|---|---|
To show Call stack window select main menu item. |
To jump to the declaration of a function double-click on the line with the function name in the Call Stack window.
You can copy function information: name, file name, line number using right-click menu or press Ctrl + C hotkeys.