Debugging
PHP Debugger allows you to debug any fragment of code in your project. During the debugging process, you can control all available data and variables in executable scripts. Practically, debugging process means the following workflow:
-
For project specify the Project URL for debugging and Project Home URL.
-
Set a breakpoint at each line where PHP source code execution should pause.
-
Start a debugging session pressing F5 or using main menu item, it opens as a next page in your default browser.
![[Note]](images/admon/note.png)
Note To start debugging from project home URL press Shift + F8 or select main menu item.
-
Perform actions to execute a script (input some data, click on links, or buttons).
-
When the debugger reaches the breakpoint, it will open the CodeLobster IDE window.
-
When a line with a breakpoint is reached, execute the script one line after another by pressing F10 () and F11 (). Monitor the state of the application in the debugger windows.
You can inspect any available data, variables, and control process of execution using debugging tools.
-
Close the debugging session.
URL debugging
This procedure describes how to debug a URL on a server to which you have access. To start URL debugging:
-
Move to or press F8
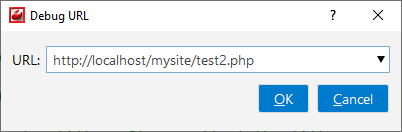
-
In the appearing Debug URL dialog enter the URL of the first page that should be debugged.